All industrialised societies feature some kind of welfare system: institutions of the state that transfer material resources to certain categories of people or people who find themselves in certain kinds of situation. Non-industrialised societies have systems of social transfers too, albeit sometimes more informal and not organised by the state. People seem to think this is a good thing, or at least necessary. This raises the question: what do the public think a good welfare system would be like? How generous do they want it to be, and how would they like it to distribute its resources?
Polls in European nations consistently find most people expressing strong support for the welfare state. But there is a problem with this: when asked, a lot of people express support for tax cuts too. And for lots of other things, things that probably can’t all be achieved at the same time. This has led to one view in political science that most people’s policy preferences are basically incoherent (and hence, not much use in setting public policy). There is another interpretation, however.
Imagine you ask me whether I would like more generous benefits for people with disabilities, and I say yes; and you ask me if I would like tax cuts, and I say yes to that too. This might seem incoherent. But really, you should interpret my response to the first question as being other things being equal (i.e. if this move could be made without perturbing anything else) then I would favour more generous benefits for people with disability; and other things being equal I would favour tax cuts. Well doh. Of course if you could have lower taxes and everything else remain just as good, that would be nice. If you ask me about tax cuts without telling me about what would have to be discontinued to allow for them, you are implying they could be made with no loss to other social goods. But favouring tax cuts that cause no loss to other social goods is a totally different position than favouring tax cuts at the expense of something else. We should not confuse the two (and hence, by the way, you should distrust polls who say that say 107% or whatever of the British public want tax cuts; 107% of them also want better hospitals too). There is nothing incoherent about favouring other-things-being-equal tax cuts, but also preferring spending on benefits to be maintained in the event that the two goals conflict.
In other words, just asking people baldly about one thing, like tax cuts, doesn’t really tell you about the most interesting question, which is: given that different social goods, all of which we might want, are in conflict, how do you – the public – want them to be traded off against one another? How much more tax would you pay for higher benefits, or how much more poverty would you tolerate in order for taxes to be lower?
A popular method for studying how people make policy trade-offs is the conjoint survey. The researcher thinks of all the possible dimensions a policy could vary on. Let’s imagine our policy is a meal. It could vary on the dimension of cost (with levels: $1, $10 $50, etc.); deliciousness (1-10); style (French, Chinese , Italian, Ethiopian); nutritional value; carbon footprint; and so on. Now, we randomly generate all the possible meals within this multiverse, using all the combinations of levels of each attribute. Then we repeatedly present randomly chosen pairs of these policies, and the respondent says which one they think is better.
Because of the random generation, some of the policies are unicorns: the utterly delicious meal that costs $1 and has minimal carbon footprint. And some are donkeys: the $100 disgusting meal. But when you give enough choices to enough participants, you begin to be able to estimate the underlying valuation rules that are driving the process of choice. In effect, you are doing multiple regression: you are estimating the other-things-being equal effect on the probability of a policy getting chosen when its deliciousness is 6 rather than 5, or its cost $20 rather than $10. Valuation rules allow you to delineate preferences about trade-offs, by comparing the strength of a dispreference on one dimension with the strength of a preference on another. For example, people might be prepared to pay $3 for each increment of deliciousness. The trade-offs can be different for different groups of respondents: maybe those on low incomes will only pay $1 for each increment of deliciousness, meaning that in life they end up with cheaper and less delicious meals.
In a new study, Joe Chrisp, Elliott Johnson, Matthew Johnson and I used a conjoint survey to ask what 800 UK-resident adults want out of the welfare system. We made all of our welfare systems somewhat simple (a uniform weekly payment with one level for 18-65 year olds and a higher level for 65+). We then varied four kinds of dimensions:
1) Generosity: How big are the payments?
2) Funding: What rates of personal income tax should people pay to fund it? And would there be other taxes like wealth or carbon taxes?
3) Conditionality: Who would get it? What would they have to do to demonstrate or maintain entitlement?
4) Consequences: What would be the effect of the policy on societal outcomes, specifically, the rate of poverty, the degree of inequality, and the level of physical and mental health?
People in fact made very coherent-looking valuations, at least on average. And, yes, other things being equal, they wanted income taxes to be lower rather than higher. But the strongest driver of choice was the effect on poverty: people want the welfare system to reduce poverty, and they like it when it reduces poverty a lot (figure 1).
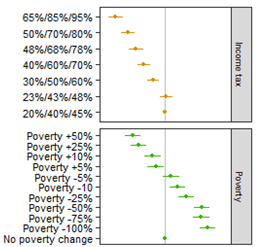
Figure 1. Estimated marginal effects on the probability of policy choice of rates of income tax (top); and effect on poverty (bottom). The dots are central estimates and the lines, 95% confidence intervals.
In the figure, a value to the left of the vertical line means that having that feature made people less likely to choose the policy, all else equal; and a value to the right of the vertical lines means having that feature more likely to choose the policy. This is compared to a reference level, which in this case is the current UK income tax rates for the upper graph, and the current rate of poverty for the lower one. So, the more a welfare system reduces poverty, the more likely respondents are to choose it; the more it increases poverty, the less likely are to choose it; and the effect is graded – the bigger the reduction in poverty, the better.
There were other features that also affected preferences. People like the idea of funding welfare from a wealth tax or a corporate or individual carbon tax, relative to the government borrowing more money. And they quite liked the welfare system to improve physical and mental health, and reduce inequality – or at least, not to make these things worse. However, none of these was as strong as the desire to see poverty reduced.
We also varied who would get the benefit (citizens, residents, permanement residents), and what the conditions would be (have to be unemployed, means testing….). None of these design features made much difference. This is something of a surprise since a big theme in the recent literature on public preference over welfare systems is the idea of deservingness: people don’t want welfare payments to go to the wrong kind of people, where wrong is conceived as slackers, free-riders or foreigners, and this saps, or can be deployed in order to sap, their support for welfare institutions. The way I read our results, these deservingness concerns are mostly pretty weak in the grand scale of things. People want a welfare system to reduce poverty in the best value-for-money way; they don’t care too much about the design choices of the institution so long as it does this.
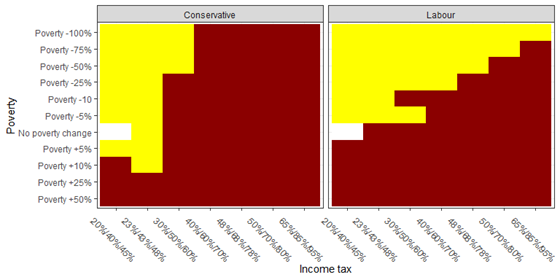
The findings shown in figure 1 allow us to pit a given income tax rise against a given effect on poverty. For example, would people by prepared to pay ten more percentage points in order to halve the poverty rate? You work this out simply by summing the coefficients, negative for the tax rise, positive for the poverty cut, and seeing if the result is greater than zero. This exercise reveals a zone of possible acceptability, a range of income tax rises that people would find acceptable for a sufficiently large cut in poverty (figure 2).
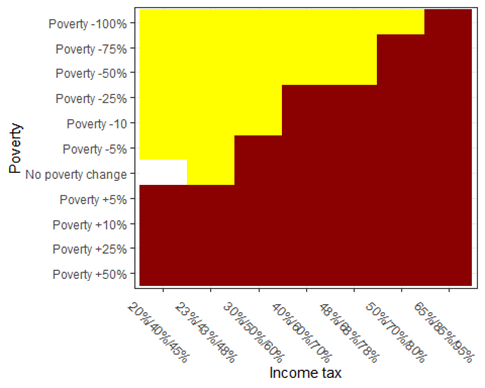
These findings are quite noteworthy. Really substantial income tax rises – ten percentage points or more – would be acceptable on our average to our respondents, as long as they delivered a big enough decrease in poverty. British political parties currenrly work on the consensus that any talk of income tax rises is politically unfeasible. The Labour Party is currently and rapidly distancing itself from any hint of tax rises of any kind, including wealth tax, which our results and other research suggests would be popular. When the Liberal Democrats proposed a 1% increase in the basic rate of income tax in 2017, it was viewed as politically risky. Our results suggest they could have been an order of magnitude bolder and it could have been popular.
A worry you might well be having at this point is: well yes, this was all true of the particular sample you studied, but maybe they were particularly left-wing; it wouldn’t play out that way in the population more broadly. In fact, we already went some way to mitigate this by weighting our sample to make it representative of voting behaviour at the 2019 General Election. Also, and more interestingly, people of different sub-groups (left/right, young/old) differed only rather modestly in their valuations. Figure 3 shows figure 2 again but respectively for Conservative and Labour voters in 2019. You might think that we would see that Conservative voters want lower tax at any cost, while Labour voters want redistribution at any price. Not at all: both groups have a trade-off frontier, it just looks a bit different, with Labout voters valuing the poverty reductions a bit higher relative to the tax rates than Conservative voters do. But both groups have an area of possible acceptability of income tax rises, and these areas overlap. Ten percentage points on income tax to halve poverty, for example, would be acceptable even to Conservative voters, and therefore a fortiori to other groups.
Perhaps these results are not surprising. We already know that there is strong support for a social safety net, and that people care about the outcomes of the worst off. Our findings just show people accept that it has to be paid for. So really the pressing question is: how have politicians come to believe that tax rises are completely politically impossible in contemporary Britain, when this and other research suggests that this is not the case? For example, a review in The Guardian of Daniel Chandler’s recent book Free and Equal, which proposes a moderate Universal Basic Income and tax rises to find it, basically said: nice idea, but who’s going to vote for that in the Red Wall? (The Red Wall refers to electoral districts in the Midlands and North of England thought of as something of a bellwether. ). Yet, both our present study and our previous research in the Red Wall give the same answer: most people. Chandler’s proposals are exactly in the zone that commands broad assent in the Red Wall, and even amongst people who have recently voted Conservative.
Without wanting to go too dark on you, I have to remind you of the evidence that the opinions of the average voter don’t actually matter very much in politics as it stands (at least in the USA). What parties propose is influenced by the views of the rich and by organized business, and pretty much unresponsive to the views of everyone else. Interestingly, this narrow sectional interest gets mythologised and re-presented as ‘the views of the person in the street’; but this is mainly a kind of ‘proletariat-washing’. A small group of people who have a lot of power and influence don’t want to reduce poverty by raising taxes. The Labour party, by choosing not to propose doing so, is courting this group. What gets passed as wooing the public is really wooing the elite. They might have judged, and perhaps rightly, that wooing this group successfully is necessary to win power, but let’s not confuse this with following public preference. The median British voter may well favour something much more transformational.
